SEO Reporting for MENA Clients: A Practical Dashboard Framework
A client-ready SEO reporting framework for MENA campaigns that separates visibility, traffic, engagement, leads, technical health, and publisher campaign outcomes.
SEO reporting for MENA clients needs to explain more than rankings and total organic traffic. Decision-makers need to understand whether the campaign is reaching the right markets, attracting relevant visitors, improving the website experience, and contributing to qualified demand. A report that presents a long list of metrics without context can create activity without clarity.
This guide outlines a practical dashboard framework for agencies managing Arabic SEO, multilingual websites, and publisher campaigns across the Middle East and North Africa. The aim is to make performance transparent, connect results to business goals, and distinguish measured outcomes from assumptions.
Start with the business question
Before selecting dashboard widgets, agree on the business objective. A campaign may be designed to grow non-brand visibility, attract qualified enquiries, support a product launch, improve local-market discovery, or build authority around a specific topic. Each objective requires different leading and lagging indicators.
Define the conversion event that matters: a qualified form submission, booked call, completed purchase, demo request, or another agreed action. Document the event definition and exclusions. If analytics counts every button click as a lead, the report may overstate results. Work with the client to define what constitutes a useful conversion and, where possible, connect digital events with CRM outcomes.
Layer 1: Organic search visibility
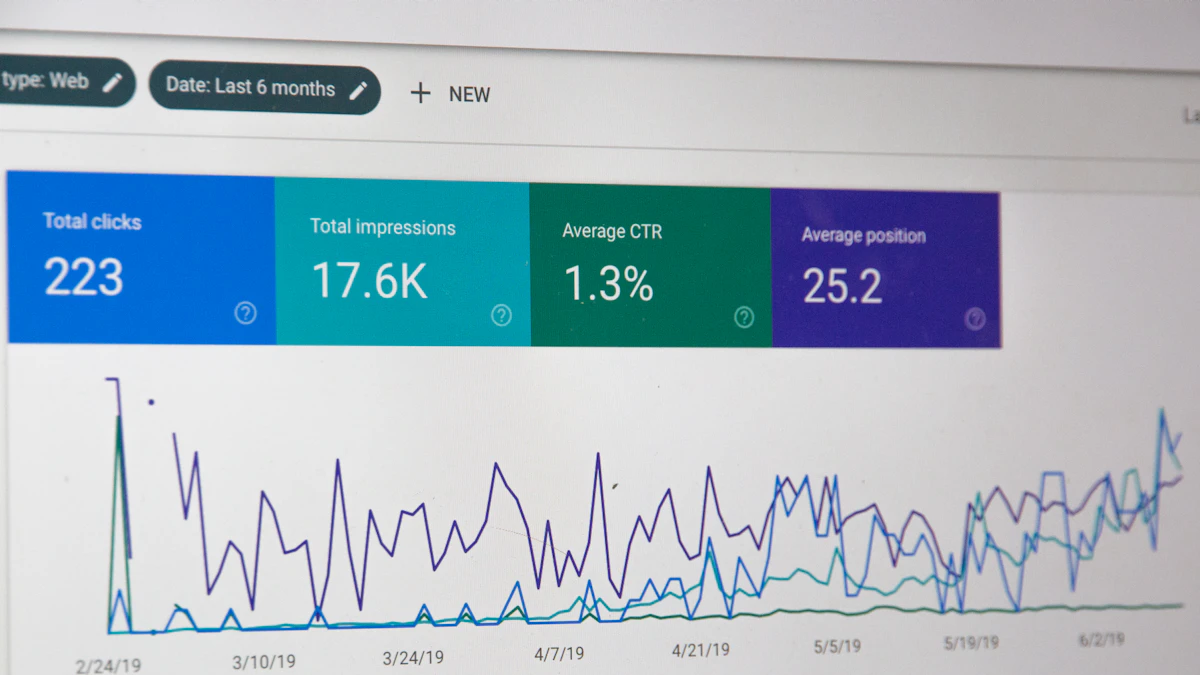
Use Search Console data to report impressions, clicks, click-through rate, and average position for relevant query and page groups. Segment by country, query brand status, landing page, and language when volume allows. A blended sitewide average can hide important differences—for example, growth in branded searches may make overall performance appear stronger while non-brand discovery remains flat.
Show priority query groups rather than a list of dozens of disconnected phrases. Group terms by intent, service line, content cluster, and target market. Include representative queries and landing pages so stakeholders can understand what the data describes. Note that average position is an aggregate indicator and can change with query mix and SERP layout, so it should not be treated as a direct measurement of business value.
Layer 2: Organic traffic and landing-page quality
Use analytics to report organic sessions or users, engaged sessions, landing-page activity, and relevant conversion events. Define the metric source and reporting dates. Do not mix users, sessions, and clicks as though they mean the same thing; explain the difference when combining Search Console and analytics data.
Review entry pages and user journeys. Are visitors arriving on pages that match their query? Do they explore useful supporting content? Can they find the product or contact path? A rise in traffic to irrelevant pages is not automatically progress. Pair traffic with engagement and conversion indicators so the dashboard reflects audience quality.
For Arabic and multilingual sites, separate markets when the sample size is useful. Compare performance across countries only after checking that tagging, consent settings, currency, and conversion tracking are configured consistently. Small samples can be noisy and should not be presented as firm evidence of market differences.
Layer 3: Leads, pipeline, and commercial impact
Where CRM data is available, report qualified leads, lead-to-opportunity progression, sales-qualified outcomes, and revenue attribution according to the client’s agreed methodology. Explain attribution limitations. SEO often assists a multi-touch customer journey, so last-click conversion data alone may not capture the full contribution of content.
Use clear definitions for “organic lead,” “qualified lead,” “assisted conversion,” and “pipeline influenced.” Avoid labelling all form submissions as revenue or claiming that a single backlink caused a sale. When integrations are not available, report the limitations and the best available proxy rather than implying that missing data was measured.
Include a small number of representative landing-page journeys to contextualise the numbers. What page did the user enter through? What relevant action did they take? Which friction point remains? This connects the data to decisions such as improving a call to action, clarifying a service offer, or updating content.
Layer 4: Technical SEO and content health
Include a concise technical-health section with meaningful indicators: indexable important URLs, crawl errors, valid canonical behaviour, sitemap status, internal-link issues, mobile usability, page performance trends, and structured-data errors where relevant. Do not overwhelm clients with every crawler warning. Prioritise defects that affect important pages or users.
For multilingual Arabic websites, confirm that language and regional targeting are coherent, canonical tags are appropriate, and right-to-left presentation is usable. Avoid counting each low-severity crawler notice as business risk. Explain the impact, priority, owner, and next action for items that matter.
Content health can include pages updated, pages with declining visibility under review, missing internal links, and content clusters with no clear supporting resources. Distinguish completed production tasks from outcomes. Publishing ten articles is an activity metric; visibility, engagement, and qualified demand are performance indicators.
Layer 5: Publisher and digital PR campaign reporting
Where a campaign includes Arabic publisher placements or digital PR, track the actual deliverables and terms agreed for each order. Useful fields include publisher name, target URL, live URL, publication date, article or placement status, link attributes where relevant, agreed placement terms, and any monitoring notes. Keep client-visible evidence attached to the row.
Evaluate publisher fit using audience relevance, language, country, editorial context, page quality, transparency of terms, and measurable referral activity. Domain Rating or similar third-party scores can be one input, but they do not demonstrate audience relevance or guarantee ranking improvement. Report the metric source and date where third-party scores are included.
Track referral visits and assisted leads when analytics can reliably identify them. Monitor whether a placement remains live according to the agreed schedule and terms, but do not promise permanent placement or indexing unless the specific agreement supports that claim. Search engines control crawling, indexing, and ranking decisions; the report should not imply otherwise.
Segment by country, language, and intent
A single regional total can conceal different performance patterns. Where data volume supports it, separate Saudi Arabia, the UAE, Egypt, and other priority markets. Distinguish Arabic from English traffic if the site serves both languages. Segment by brand versus non-brand query and by informational versus commercial intent to make the report more actionable.
Avoid over-segmentation when sample sizes are small. Too many filters can create unstable comparisons and encourage decisions based on noise. Agree on a limited set of standard segments, then add a focused deep dive when an important business question arises.
Design a dashboard that drives decisions
A useful dashboard begins with a one-screen summary: objective, reporting period, outcome metrics, major changes, and decisions needed. Next, show visibility and traffic trends, conversion outcomes, technical risks, and campaign deliverables. Detailed query exports and page-level tables can sit behind the summary for stakeholders who need them.
Every chart should answer a question. Use consistent date ranges, metric definitions, country groupings, and comparison periods. Annotate site migrations, tracking changes, major campaigns, seasonality, and publishing milestones. Avoid decorative charts with no decision attached.
Give each issue an owner, priority, recommended action, and expected validation method. For example: “Organic impressions increased but CTR fell for the service cluster; review title alignment on the five highest-impression pages and compare the next four-week window.” This is more useful than reporting that CTR changed without suggesting a next step.
Choose comparisons carefully
Month-over-month comparisons are useful for operational checks but can be distorted by seasonality and day count. Year-over-year comparisons may be more appropriate for recurring markets. Always state the comparison period and whether data is complete. If the date window includes a tracking change, explain it rather than presenting a misleading before-and-after chart.
Use leading indicators, such as indexing and impressions, alongside lagging indicators, such as qualified leads and revenue. Not every new page will generate leads immediately, and commercial results can depend on sales processes outside SEO. Set realistic review windows based on the campaign and explain the sequence of expected signals.
Reporting cadence and governance
Weekly reports should focus on operational exceptions, urgent technical issues, and campaign delivery. Monthly reporting can evaluate trends and decisions. Quarterly reviews can revisit strategy, market prioritisation, content investment, and the link between organic demand and pipeline. Choose a cadence that matches the volume of meaningful change, not just a habit of sending spreadsheets.
Document the source for each metric, refresh timing, data owner, and any known limitations. Set access appropriately and avoid exporting personal data that is unnecessary for the analysis. If reports are automated, include checks for failed connections, missing dates, duplicated conversions, and changed field definitions.
Common reporting mistakes
Reporting rankings without conversion context or business objectives.
Combining clicks, users, sessions, and leads without defining them.
Attributing revenue to one channel without explaining the model.
Using third-party link metrics as proof of publisher quality or guaranteed outcomes.
Presenting traffic increases as success when visitors are unqualified.
Comparing markets without checking tracking consistency and sample size.
Automating charts without validating data quality and date completeness.
A client-ready monthly report checklist
Confirm the business objective and reporting period. Validate analytics and Search Console data. Segment core trends by market, language, and intent where reliable. Report conversions using agreed definitions, summarise technical risks, and list publisher deliverables separately from outcomes. Explain the three most important changes, show the evidence, identify open risks, and end with decisions or actions assigned to an owner.
Conclusion
Good SEO reporting gives clients an accurate picture of visibility, audience quality, website health, campaign delivery, and commercial contribution. The best dashboard is not the one with the most metrics; it is the one that helps a client decide what to do next and shows which evidence supports that decision.
For MENA-focused campaigns, clear segmentation and careful language are especially important. Report what was delivered, what changed, what remains uncertain, and what the next test will measure. This keeps agency-client communication transparent while connecting organic search and publisher activity to the outcomes they are intended to support.
How do you verify the quality and metrics of your Arabic publishers?
We continuously audit publishers using Ahrefs metrics (DR, organic traffic), index stability, and spam scores to guarantee authentic, high-value media placements.
Are article placements permanent and guaranteed to be indexed?
Yes, all sponsored articles and Digital PR placements are non-removable and come with a 100% Google indexation guarantee or full refund.
What is the average turnaround time (TAT) for publishing?
Standard publication turnaround time ranges between 3 to 7 business days depending on the selected media outlet and editorial review.
Can PublishBridge handle Arabic content creation and localization?
Absolutely. Our in-house editorial team creates tailored, high-converting Arabic press releases and articles optimized for regional search intent.
Do you offer custom agency discounts or bulk pricing?
Yes, we provide volume-based discounts and custom invoicing solutions for SEO agencies managing multiple client accounts.
Stay Ahead in Arabic Digital PR
Subscribe to receive exclusive insights on MENA search trends, new verified publisher additions, and agency strategies.
Need a Custom Media Strategy?
Schedule a brief consultation with our Arabic Digital PR specialists to discuss your campaign targets and custom bulk pricing.